I spent a week teaching a mini-unit on Statistics & Probability in my grandson Charlie’s 7th grade class. Here I describe Alphabetical Probability, one of the eight menu investigations from the mini-unit I presented that week. This investigation connects statistics and probability to the English language. Students collect and organize data about the frequency of letters in a sentence from a book, post their data on a class chart, and then compare their data to the actual frequency of letters.
Setting the Stage for the Investigation
I began the lesson by asking students to think about which five letters of the alphabet are most commonly used in the English language. After they talked in their groups, I had them report their ideas and explain their reasons. Carolina said, “The vowels are probably most common because all words have them.” James thought, “I think the letter ‘s’ has to be one because we have so many plurals.” Andrew said, “Maybe ‘e’ and ‘d’ because we use them a lot with past tenses.” It was a lively conversation.
Giving Directions
I then posted these directions and gave time for the students to read them. I also posted a class chart that listed the letters from a to z.
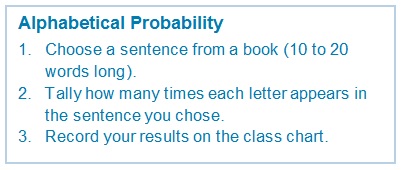
I reviewed the directions with the class, telling them, “Each of your sentences will be a small sample of how often letters are used. But when we collect the data from all thirty students on the class chart, we’ll have a much larger sample of the frequency of letters.” I intentionally used the language of “sample,” “data,” and “frequency,” not defining these terms but embedding them in the context of the investigation. I used the mathematical terminology as often as possible.
I asked for questions. Adam wanted to know if they could choose any book they wanted. (I answered yes.) Lizzie wanted to know if they could work with a partner. (I answered yes, but they each had to collect data for a different sentence.) Joey wanted to know about making tallies. (I reviewed how to use cross-hatches to show groups of 5 and talked about how they were to add tallies on to those already on the chart.) Then they got to work.
Collecting Data
The room got noisy for a few moments, then quieted down as students began to collect their data.
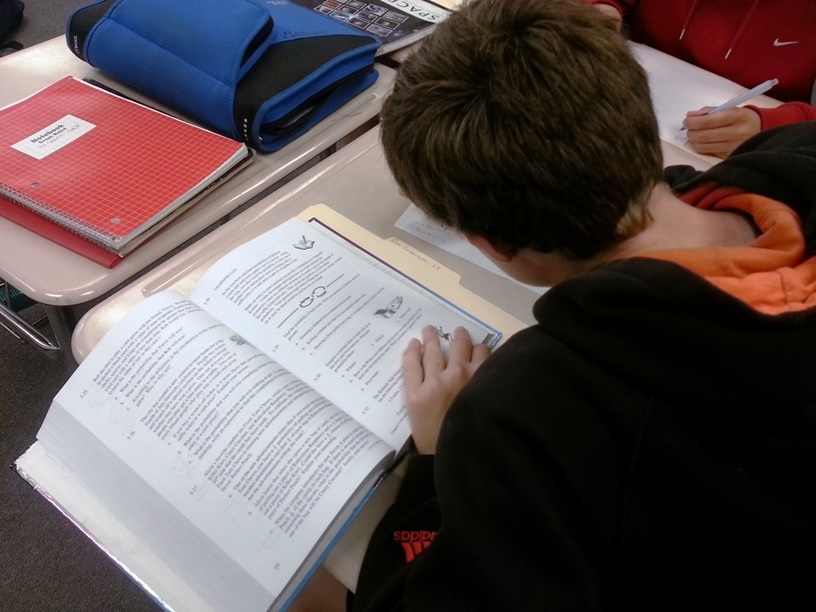
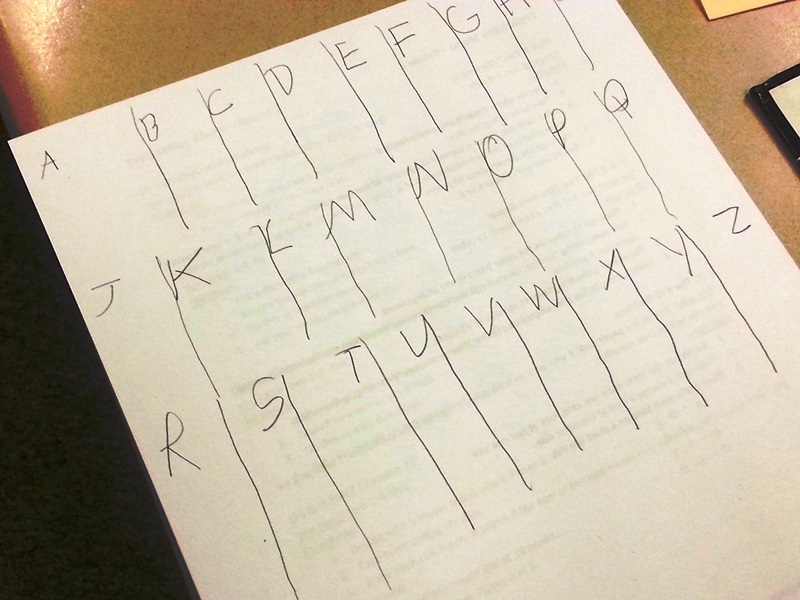
I hadn’t given students directions about how to organize their work. I purposely didn’t prescribe a method, instead giving them the opportunity to decide for themselves. I think it’s valuable for students to have experiences organizing their work in ways that make sense to them, instead of giving them prepared worksheets to complete. Students recorded in different ways, and later I had them share their papers so that they could see other options.
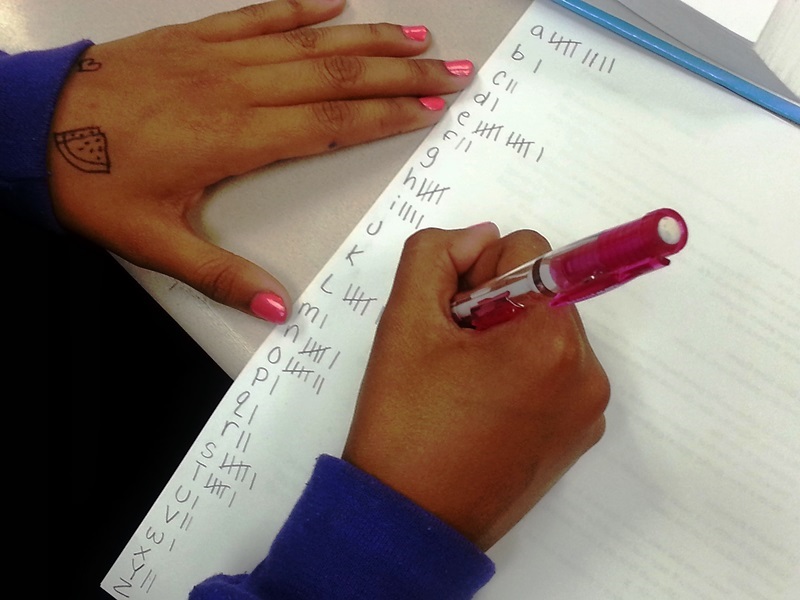
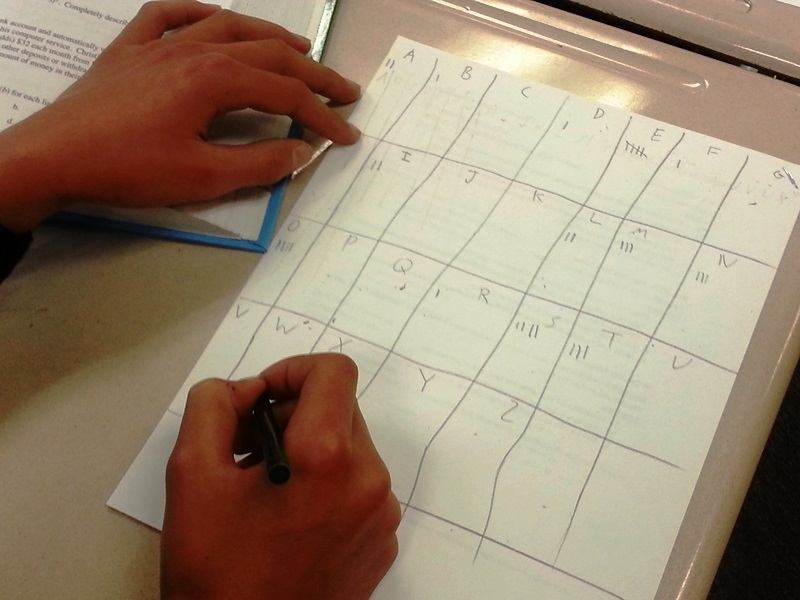
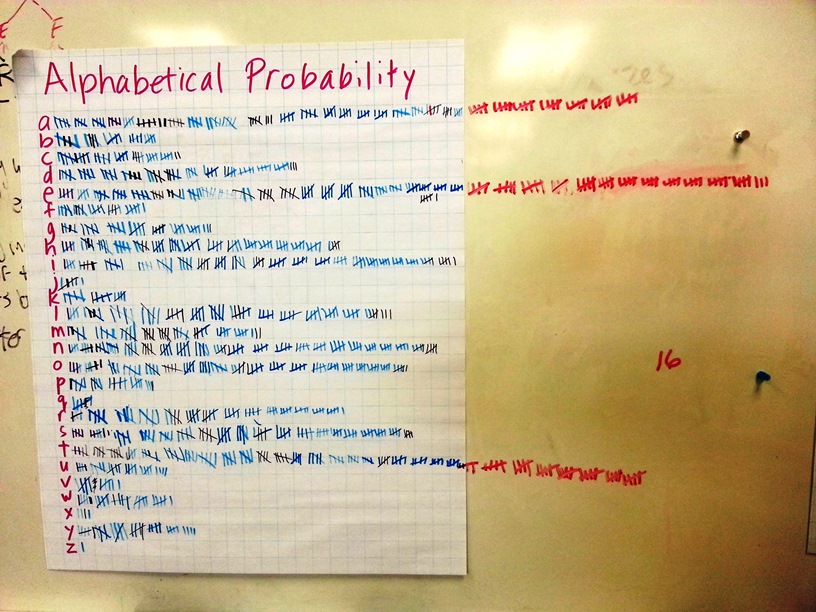
As I wrote above, this was part of a larger menu that included other investigations and class charts for recording. Two days later I focused their attention on the Alphabetical Probability class chart.
In the meantime, I prepared a strip of adding machine tape with the letters of the alphabet written on it in their actual order of usage according to our English Letter Frequency. (This was based on a sample of 40,000 words.) I rolled up the strip and secured it with a paper clip.

English Letter Frequency, Cornell University
Analyzing the Class Data
When the class looked at the data everyone had recorded on the class chart, I asked which letter occurred most frequently. It was obvious that it was e. (Jake counted and e had occurred 179 times.) It was also obvious that z occurred least often. (It occurred once.) I asked them to work in pairs and list the letters in order from e, which was used most, to z, which was used least. I showed them how to put brackets around letters that were used the same number of times. There was a little confusion about some tallies that hadn’t been made correctly or clearly, but I told them to do their best.
After everyone had listed the letters in the order of their frequency from e to z, I asked Julia to read the list she and Cora had prepared. On the board, I wrote the letters as they read them, spacing them to match as closely as possible to how I had written the letters on the adding machine tape.

English Letter Frequency, Class Data
Then, under our class list, I taped the list I had prepared, still rolled up. I told them, “This is the actual order of the usage of letters based on a sample of 40,000 words. Our class data represents between 300 and 600 words. Watch as I unroll the list and we’ll see how the data from our class sample compares to the actual frequency of letters.” The students were curious as I unrolled the tape, eager to compare it to what their data had produced. While the letters weren’t exactly in the same order, the similarities were impressive when I grouped them as shown below. The students were pleased.

Summarizing and Extending
Alphabetical Probability addresses grade 6 and 7 Statistics and Probability content standards. The investigation engages students with several important mathematical ideas: summarizing and describing distributions, using random sampling to draw inferences, and comparing inferences. I used the content standards as my guide for discussing how we can gain information about the usage of letters by examining a sample and about the benefits of larger samples.
I also related the activity to other contexts. We talked about games where this information is useful, such as Scrabble and Boggle. Also, I gave them a language challenge of choosing one of the six most common letters and writing three sentences without using the letter they chose. (I gave them an example of three sentences without the letter e: This is odd. Do you know why? Try and find out.)
*** Thanks to Annie Adams and her class of 30 seventh graders at Henry Hall Middle School in Larkspur, California.


Another lovely lesson, Marilyn!
It occurs to me a nice context for this lesson could be crytography, where finding letter frequency is one of the classic tools for decrypting a substitution cipher.
I like your mention of writing without using a letter too. It makes me think of La Disparition (in English, A Void), the novel Georges Perec wrote entirely without the letter e! (I haven’t read it – yet.)
Georges Perec must be a driven man. Thanks for your comment.
This is so interesting. When I watch Wheel of Fortune people often choose C, D, M, and A during the bonus round when they are asked to select three consonants and one vowel not in the set (R, S, T, L, N, and E). The letters R, S, T, L, N, and E are always freely given in the bonus round. I’ve often wondered if all of the years of reading caused players to realize that beyond the “free letters”, C, D, M, and A are the most common letters in the English language. And I’ve wondered if it is generous, or not, for the Wheel of Fortune program to always give freely, the letters R, S, T, L, N, and E. After looking at the chart in the article, it looks like the Wheel of Fortune is being generous. Also, C, D, M and A are pretty good choices. However, players might consider trading the C for a G or an H or … (I didn’t do a complete analysis).
Thanks for the connection to Wheel of Fortune, another example of how the mathematics might help.
I actually found an interesting article about letter frequency and Wheel of Fortune that I think will be great to share with my students.
https://www.washingtonpost.com/news/wonk/wp/2015/01/05/how-to-win-wheel-of-fortune/?utm_term=.ba18eec89f13
Yes, interesting! Thanks for sharing. I’ll send the link in a Tweet so more can enjoy.
I’ve used this lesson in a “Think Tank” for my 4th graders. They use the materials in small group work while I do RTI with other students. They enjoy seeing and comparing the results each group gets from the sentences chosen.
I love this lesson! I tried it with my 5/6 challenge group and they did a great job!
Statistics are exponentially more important today than 20 years ago and that trend is only increasing. So I’m appreciative that you are showing us teachers that we can make statistics as exploratory and engaging as other early math topics.
I especially liked this: “I think it’s valuable for students to have experiences organizing their work in ways that make sense to them, instead of giving them prepared worksheets to complete.”
I’d add it’s just as important for them to be able to make a mistake in how they choose to organize their work as it is in solving any other problem.
Thanks, I really enjoyed this lesson. I am just starting to understand the importance and the “how to” of teaching statistics to my students. This lesson helped me a great deal.
Again,
Thank you…
This is a fantastic way to incorporate reading with math. Some of my students in my Algebra class have very low skills. I think they would be receptive. What a great way to get kids reading in math! I am going to use this exact activity to introduce the Statistics and Probability strand in my Algebra class later this year.
In a community with multiple languages spoken, it would be great to do an extension with several other languages.
I agree. That’s been on my mind for a while. Thanks for posting.