I’ve been intrigued for a long time about Slow Reveal Graphs and finally decided to try one with fourth graders. I’m not sure why I waited until nearly the end of the year, but I’m glad I squeezed it in before summer break. It was a terrific experience for me and for the students.
If you’re not familiar with Slow Reveal Graphs, it’s an instructional routine designed to promote students’ sensemaking about data. You show the class a sequence of PowerPoint slides (each slide reveals a bit more about the graph) and you ask questions that engage students in discussing what they see and what it means.
The website has options for all grade levels and I reached out to Jenna Laib for help with deciding which might be a good first experience for me. With Jenna’s advice, I selected Heartbeats per Minute and Body Weights of Different Species.
To prepare, I pored over the PowerPoint for the graph on the website. Then I did what I think we as teachers always do when using someone else’s lesson plan—I tweaked it and made some changes. Nothing substantial, but things that I thought would be useful. One change was that I made some of the type on the slides larger to make it easier for the students to see. Another was to add a slide that led to a writing assignment for the students. Here’s my PowerPoint.
The First Slide
I projected the first slide and asked, “What do you notice?”
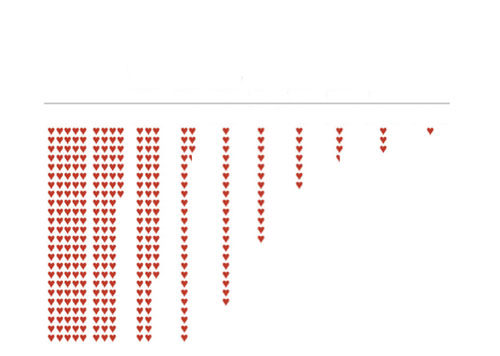
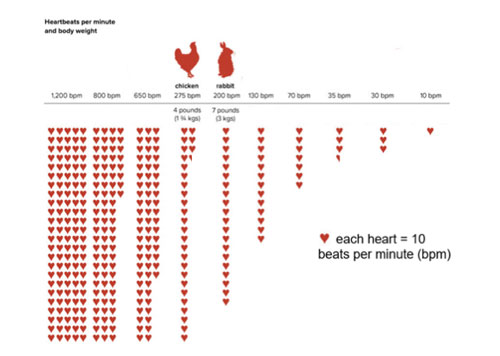
The first slide showed this arrangement of hearts.
I called on everyone who was interested in contributing. There were lots of comments.
“I see hearts.”
“There’s a line at the top.”
“I notice there are lots of hearts on the left and only one on the right.”
“Ooooh, I see some hearts that are only half.” (I pointed these out so all were aware of them.)
“Some columns have more rows than columns.” (I talked about rows and columns, two words that I’ve found students often confuse.)
“I counted and there are 20 in a column.”
“No, I got 22.”
“I got 24.” (It was hard for them to count accurately from where they were sitting on the rug, so we counted together as I pointed to the hearts in a full column. A full column has 24 hearts.)
I then asked, “What do you wonder about this display of hearts?” Again, I let all students who were interested contribute.
“I wonder why they are in those groups.”
“Why are there more on the left?”
“I wonder if it’s a graph.”
I interjected something that I was wondering about. “I wonder how many hearts are in the far-left block with 5 columns and 24 rows.” It was a good mental math diversion for them to figure out this out.
Projecting the Next Slides
I projected the next slides, one by one, asking them to discuss the new information each slide presented. For example, they learned that each heart represented 10 beats per minute (bpm) and decided that half a heart represented 5 bpm. (The notes on the PowerPoint slides include the questions I actually asked.) Their interest kept building, along with their excitement.
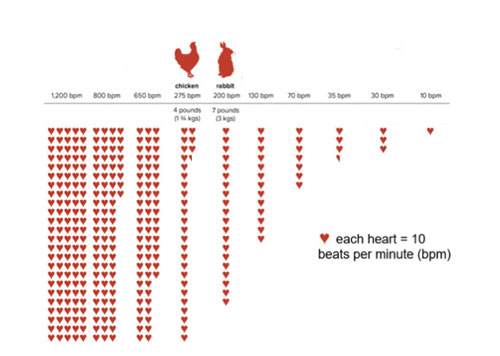
This is the fifth slide in the lesson.
For the fifth slide, I asked, “What do you think this graph is about?” While some students raised their hands, others blurted out ideas. The class discussion sort of erupted and I let it go a bit before calling them back to attention so we could all listen to one another’s ideas. Most agreed that the graph was about different animals’ heartrates. One boy said that the first column had to be a hummingbird and explained “because their hearts beat really, really fast.” Several predicted that the animals were arranged in order of their weight and some talked about other animals that might be on the graph. One boy said, “The last column has to be a blue whale because that’s the biggest mammal on earth.” (That was actually a question I had planned to ask in a bit.)
I then asked, “Which column do you think represents the horse?” Again, there was an eruption of comments as students predicted. I quieted them and showed the next slide to reveal the column that represented the horse.
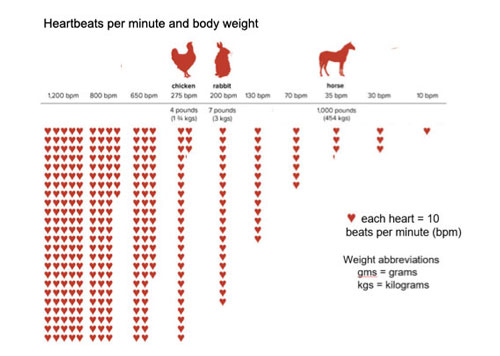
After showing the graph with the horse, I asked the students which columns they thought represented a cat, and then a mouse.
I continued projecting slides revealing more and more information until the graph was complete.
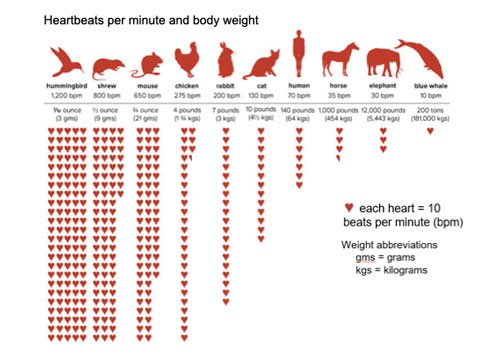
This is the complete graph.
About the Classroom Discussion
At the beginning of the lesson, for the first several slides, I led the discussion using the usual protocols of giving students time to think after I posed a question, having one student speak at a time, asking students to listen to each other, having them turn and talk when I wanted them to have a bit more time to think about something (for example, when I asked how many hearts were in the first block).
After a few slides, however, the students became more and more excited and each successive slide resulted in a barrage of blurted comments. I let it go, making the decision not to contain their ideas. I confess it wasn’t my finest teaching hour—you know the kind of chaos that can result from that sort of situation. That said, after showing the last slide with the entire graph, I got their attention back to do several final things.
Showing a Video
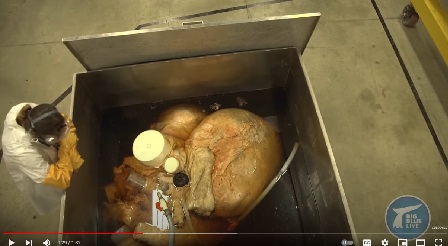
The students quieted down when I introduced “Big Blue Live,” the video that’s included in the PowerPoint. It’s a BBC video that runs about a minute and a half and talks about how big a blue whale’s heart is. The students were glued to the screen as they watched and seemed especially impressed when the scientist told them that the whale’s heart was big enough that they could swim through its aorta.
Giving an Assignment
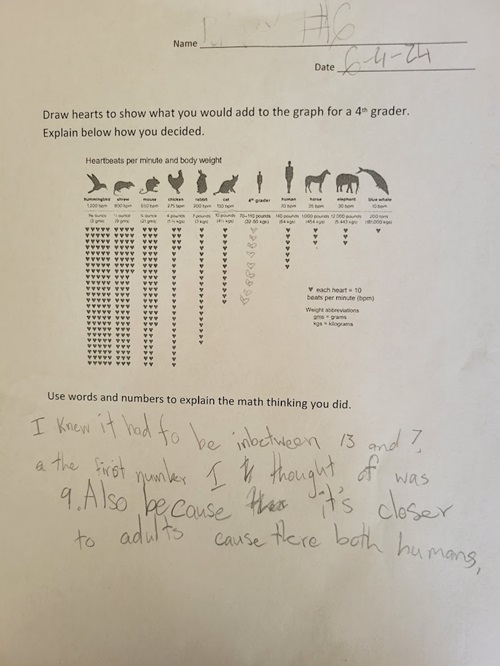
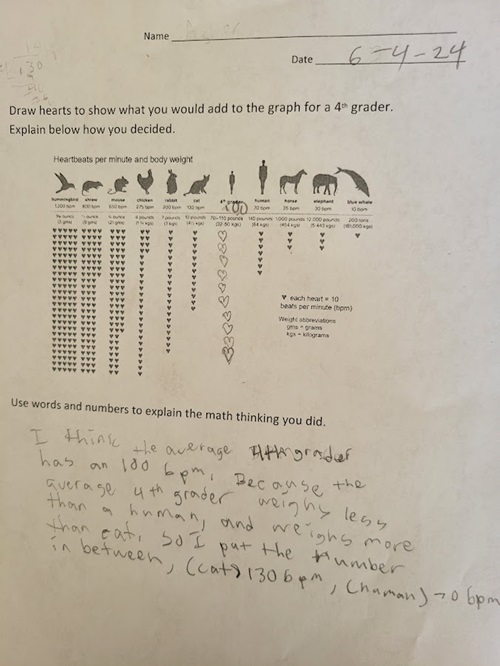
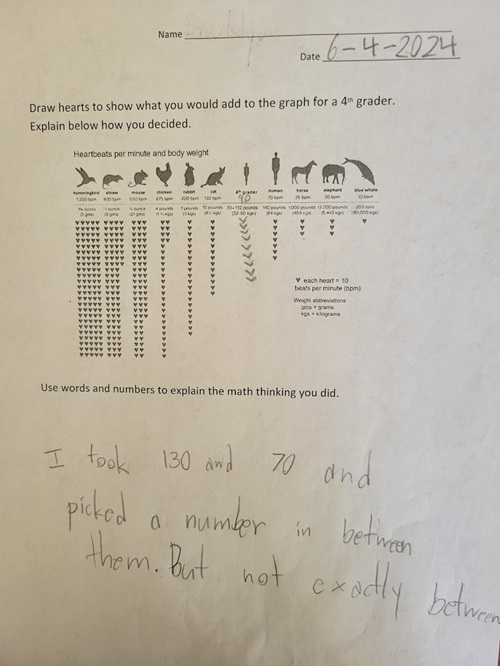
I’m always interested in having students write and it’s important to me to structure writing assignments that reveal students’ math understanding. To introduce this writing assignment, I asked where they thought a column for a 4th grader should go. They agreed that a 4th grader was smaller than the human on the graph and bigger than a cat, so it should go in between them. I had created a worksheet for them (which you can access here) that had the column for 4th graders inserted and gave them the task of drawing the number of hearts that would be appropriate in the column and write about how they decided. They spent the rest of the time completing the assignment.
Final Thoughts
I really liked this lesson. I liked how the slow reveal gave students a bit more information to absorb each time, which seemed to give more students access to the information. In my past experiences asking students to interpret graphs, a graph often presented way too much information at once for students to process. Also, the slow reveal gave a sense of drama to the experience that kept the students engaged. I plan on trying more with other classes.
The source for the information was this terrific book, Animal Facts by the Numbers by Steve Jenkins. It’s a treasure.
I give scientific lectures about my research to fellow scientists. I always use what I call “sequential reveal” in my powerpoint presentations: bring up one new fact/feature/assertion at a time, so that the audience can absorb them one at a time, rather than presenting them with multiple things at once.
It’s wonderful that the idea can work with young children and adult scientists! Thanks for the commit.
I’m curious–what did you do with the writing assignments once students had completed them?
Thank you for the lovely article, I enjoyed reading it.
This is such an important question. I confess since this was the end of the year, I didn’t get back to them with the students. But typically I do a variety of things. I sometimes find ideas that are useful for a class discussion. I often push for rewrites to clarify things that aren’t clear or to add more details. I sometimes post for a gallery walk. I did that in this blog: https://marilynburnsmath.com/fractions/an-important-teacher-decision-when-and-when-not-to-give-the-answer/ I find that engagement grows the more I involve students in writing and using their ideas to stimulate discussions. I hope to make this an even bigger focus next year.
I’m teaching 4th grade in Korea. And I’ve read your books about math classes. I learned a lot from your books. Thank you^^ I want to share my math classes and I wanna got feedbacks from you. I think the math text book of Korea is focused on arithmetic or algorithm. So I want to study abroad and change Korea’s math class. This is my dream. And this message is my first step to my dream. Can you help me?
Thanks so much for your comment, and for sharing your dream. We have a variety of ways in the U.S. to learn about teaching math. One is our national organization, the National Council of Teachers of Mathematics, which has an annual conference in September and many smaller conferences. Check out their website: https://www.nctm.org/ And many of our colleges and universities offer programs for graduate studies about math teaching. I hope these are useful first steps.